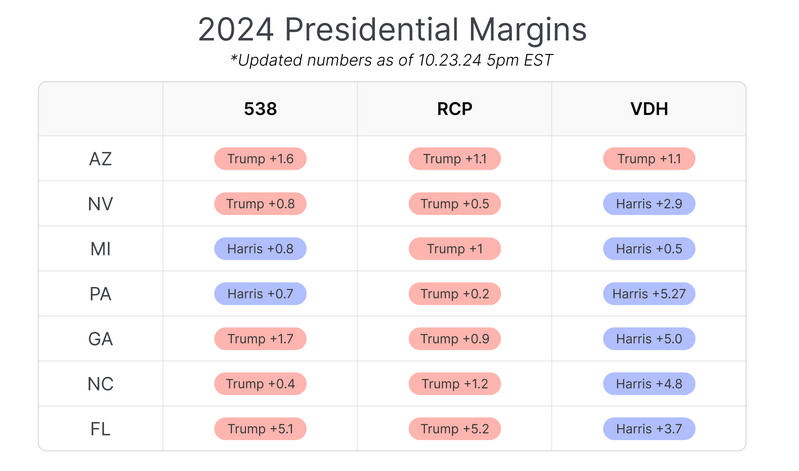
Hopium? This blog is suggesting an incredible margin of victory for Harris.

VDH is the website. They are outright calling respected meta-polls FiveThirtyEight and RCP completely wrong. Their overall argument is that the Senate-race is incredibly favored in the Democrat’s favor.
I don’t know if I necessarily believe that argument. But its still interesting to think about. Discuss?


Watching early vote exit polls is kind of a tough game to play prognosticator on, but it begins to give us a sense of what the polls mean, because the info is a lot more concrete than polls. Basically, polls have a segment of responses that are undecided, meanwhile exit polls don’t. The idea as I understand it is that you can contrast exit polls with polls in order to discern what that undecided vote really seems to be breaking for.
In 2016, that undecided segment broke hard for Trump. It hasn’t in any election since.
Here’s what exit polls so far say about Trump (vs 2020) and Harris (vs Biden & Obama):
Obviously, again, exit polls are subject to swings and changes over time and so it’s all contingent on this continuing, but right now the early votes exit polls are at severe contrast with the aggregators. Like, embarrassingly severe.
One remaining thing from the exit polls worth mentioning - the last minute surge of support for Trump in 2020 was largely because the Republican leadership was stalwart in telling everyone to vote only on election day. That isn’t happening this year, though, which means that Republicans aren’t going to be able to expect the same kind of last-minute surge this year. Meanwhile, the opposite seems true for Harris: a lot of early votes for Harris are first time voters or infrequent voters, and not from the pool of 2020 early voters.
So, at this point the early vote is around 40m, or 25% of total votes in 2020. In order to get back to the “surprising Trump upswell” that we’re all worried about, this trend would have to not only stop, but AGGRESSIVELY reverse course. Either that or all the exit polls are horribly wrong.
You mention Trump as up in 18-39 and 50-64 but down in “a bunch of other age groups.” How many other age groups are there? 40-49 and 65+ seem like only way to back them up with any significance.
Oh shoot, sorry, I meant 18-29. The groups are:
It’s worth mentioning that these groups are not equal! 18-29 is usually a very low representation, where 40-49 is pretty big, and 50-64 / 65+ are huge.
Boomers potentially saving us from Trump was not on my 2024 bingo card (I know that is from a higher base of existing Trump support but still).
And that’s the #1 problem with polling.
Look at 538 for PA:
https://projects.fivethirtyeight.com/polls/president-general/2024/pennsylvania/
Here’s what people miss… Go down the LEFT hand column.
860LV
1,586LV
840LV
812LV
812LV
866RV
866RV
794RV
583LV
794RV
1,084LV
1,256LV
2,048LV
2,048LV
600LV
600LV
“LV” - “Likely Voters”.
Of these 16 polls currently up, 12 of them are trying to determine who is “likely” to vote, and no 2 polls use the same definition.
Generally “Did you vote in the last 2 elections?”
Yeah, every time I wind up looking deeply at polls I find more questions than answers. I recognize they’re a snapshot of a segment, not representative of the whole segment but sort of a sampling of it.
For example, the 3 polls there from Franklin, and the 4 from Morning Consult: the same methodology and around the same sample size, conducted at the same time frame. Each poll with different outcomes from their sample set.
I also recognize that as long as X% are “undecided”, the poll can’t really show anything other than trend motions. And these polls are actually kind of static. Like if you plot them all out, they don’t seem to have an upper or downward trend trajectory.
It’s frustratingly ambiguous stuff.